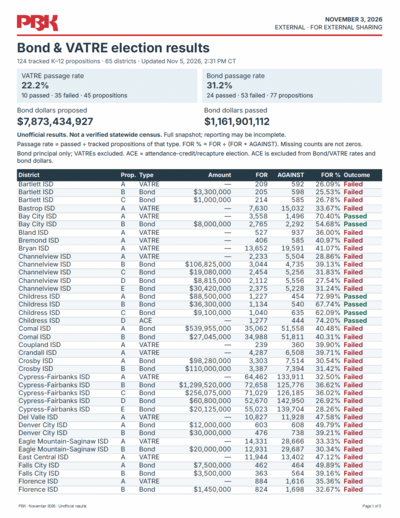
Results for 128 tracked bond and voter-approval tax rate election (VATRE) propositions across 69 Texas school districts. Updated Nov. 7, 2026, 12 p.m. CT.
Historical context, affordability and community-led election planning. These insights describe the reviewed November snapshot, not the selected map region or table filters.†
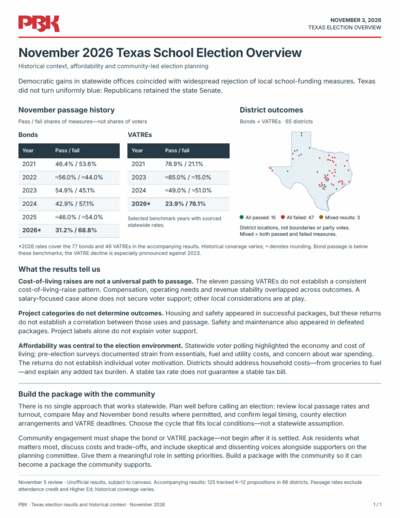
Cost-of-living raises are not a universal path to passage.
The 13 passing VATREs do not establish a consistent cost-of-living-raise pattern. Compensation, operating needs and revenue stability overlapped across outcomes. A salary-focused case alone does not secure voter support; other local considerations are at play.
Project categories do not determine outcomes.
Housing and safety appeared in successful packages, but these returns do not establish a correlation between those uses and passage. Safety and maintenance also appeared in defeated packages. Project labels alone do not explain voter support.
Affordability was central to the election environment.
Statewide voter polling highlighted the economy and cost of living; pre-election surveys documented strain from essentials, fuel and utility costs, and concern about war spending. The returns do not establish individual voter motivation. Districts should address household costs—from groceries to fuel—and explain any added tax burden. A stable tax rate does not guarantee a stable tax bill.
Build the Package With the Community
There is no single approach that works statewide. Plan well before calling an election: review local passage rates and turnout, compare May and November bond results where permitted, and confirm legal timing, county election arrangements and VATRE deadlines. Choose the cycle that fits local conditions—not a statewide assumption.
Community engagement must shape the bond or VATRE package—not begin after it is settled. Ask residents what matters most, discuss costs and trade-offs, and include skeptical and dissenting voices alongside supporters on the planning committee. Give them a meaningful role in setting priorities. Build a package with the community so it can become a package the community supports.
November passage history · View benchmark comparisons
Pass / fail shares of measures—not shares of voters. Selected sourced benchmarks; historical coverage varies. ≈ denotes rounding.
Bonds
Year
Pass
Fail
2021
46.4%
53.6%
2022
≈56.0%
≈44.0%
2023
54.9%
45.1%
2024
42.9%
57.1%
2025
≈46.0%
≈54.0%
2026*
31.2%
68.8%
VATREs
Year
Pass
Fail
2021
78.9%
21.1%
2023
≈85.0%
≈15.0%
2024
≈49.0%
≈51.0%
2026*
26.5%
73.5%
*2026 reflects the current snapshot: 77 bonds and 49 VATREs, excluding attendance credit and Higher Ed. It is not a verified statewide census. The 2022 and 2025 statewide VATRE benchmarks remain unresolved and are omitted, not treated as zero.
* Bond principal only; VATREs are excluded. Attendance-credit/recapture measures are excluded from bond dollars and Bond/VATRE passage rates. Passed dollars use the same unofficial outcomes shown in the table. Rates count propositions, not votes.
† Polling context comes from early-voter and pre-election surveys, not a conventional exit poll; it does not establish why a particular proposition passed or failed.